In my time as a software engineer, I have found that when inheriting legacy software it is overwhelming for the product and engineering team to know where to begin making changes.
Unlike wine, software does not get better with age. One thing I have learned is that if you don't have the data to make an informed engineering decision—then the first step has to be acquiring the data to decide what to do first and to know when to move onto the next thing.
Last year, my team took ownership of an acquired product that had seen very little active development over the previous five years. One common theme from user feedback was that the application was slow, both in terms of workflow and latency. As we dug into the code, it was evident why the product was slow. The code was written in Visual Basic—which I had last used in high school in conjunction with a drag-and-drop programming tool to make Blackjack. The VB code executed database queries, looped through the results executing more queries for each result row, then more loops and more queries, all along the way generating HTML inline with the SQL queries.

As the data grew, the time it took to render the page grew exponentially. Making improvements to it in place looked hard; there was no separation of concerns so touching the queries meant everything else would need to change as well.
So the users knew the application was slow and the engineers knew the application was slow and would not be able to scale, but if we were going to try to fix it, we needed to first address two key questions: how do we prove that we've made it faster once the code was refactored? And how would we know when we've made it fast enough? The application was already logging things to an open-source, client-side data collection tool called Piwik. We added timers around the page load and made an ETL job pulling out the data and writing it into a visualization tool so we could see how the load times changed over time.
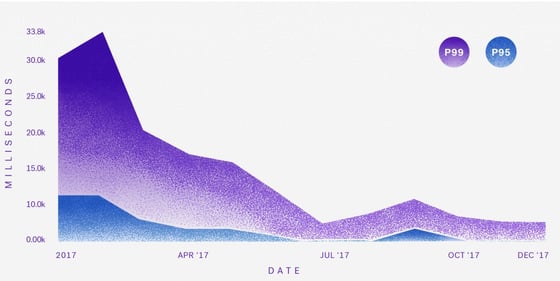
The measurement pieces went into production before any product improvements, revealing that the P90 load time was 10 seconds and the P99 was 25 seconds (!!). This means that 10 percent of page loads took over 10 seconds, and one percent took over 25 seconds! Enough time to "fix yourself a martini and grab a cigar," as one of our users put it. Now we had data to show the magnitude of the poor performance and could set a goal for how to measure the success of our rewrite. Our team set two goals:
-
Reduce the P99 time to under 5 seconds
-
Push the P99 and P90 times as close together as possible
The second goal was more nebulous, but the spirit of the goal was that large amounts of data should not be detrimental to the overall user experience if the product is to scale.
The code was refactored into C# with a React frontend. A reorganized data layer changed the page load from an exponential operation to a linear operation. The decoupling of concerns between the data layer, the business logic and the display layer made incremental feature and performance improvements easier (because the code was easier to maintain) and safer (because of the addition of many unit and integration tests). As we launched these improvements to beta partners, we saw the latency graphs drastically decrease while the P90 and P99 lines began to converge. The data was also important in deciding at which point the team had made sufficient progress and should move onto the next priority. The backlog of product improvements is long and it was important to know we had moved the needle enough on pure latency to move onto the next thing.

The key to making this project a success was that the instrumentation was a first-class citizen in the MVP. The tickets to measure and display the performance of the application were prioritized along with the product deliverable. That, in conjunction with defining a measurable picture of success, meant that our application was faster for our users - and we could prove it with data rather than relying on anecdotal evidence.


